19 search results - page 1 / 4 » Data Vases: 2D and 3D Plots for Visualizing Multiple Time S... |
ISVC
2009
Springer
13 years 9 months ago
2009
Springer
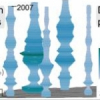
Abstract. One challenge associated with the visualization of time-dependent data is to develop graphical representations that are effective for exploring multiple time-varying qua...
Publication
Abstract—In the analysis of spatially-referenced timedependent
data, gaining an understanding of the spatiotemporal
distributions and relationships among the attributes
in the...
JCDL
2004
ACM
13 years 10 months ago
2004
ACM
We present a new approach to displaying and browsing a digital library collection, a set of Greek vases in the Perseus digital library. Our design takes advantage of three-dimensi...
IV
2010
IEEE
13 years 3 months ago
2010
IEEE
We propose an interactive framework for the 3D visualization of the time-series of Web graphs. The purpose of our framework is to enable users to examine the evolution of Web grap...
SOFTVIS
2010
ACM
13 years 4 months ago
2010
ACM
Previous techniques for visualizing time-series of multivariate data mostly plot the time along additional axes, are often complex, and does not support intuitive interaction. In ...


