10 search results - page 2 / 2 » Layout Metrics for Euler Diagrams |
BMCBI
2011
13 years 11 days ago
2011
Background: Visualization of orthogonal (disjoint) or overlapping datasets is a common task in bioinformatics. Few tools exist to automate the generation of extensively-customizab...
IV
2005
IEEE
13 years 11 months ago
2005
IEEE
This paper contains details of new criteria for graph layout, based on the concepts used in graphical design. Current graph layout criteria have been shown to be effective in meas...
INFOVIS
1997
IEEE
13 years 9 months ago
1997
IEEE
We present the H3 layout technique for drawing large directed graphs as node-link diagrams in 3D hyperbolic space. We can lay out much larger structures than can be handled using ...
SOFTVIS
2003
ACM
13 years 10 months ago
2003
ACM
Analysis and design of programs by using tools has emerged to a standard technique in object-oriented software engineering. Many of these tools claim to implement methods accordin...
VISUALIZATION
2005
IEEE
13 years 11 months ago
2005
IEEE
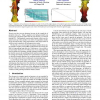
Recent years have seen an immense increase in the complexity of geometric data sets. Today’s gigabyte-sized polygon models can no longer be completely loaded into the main memor...


