10 search results - page 2 / 2 » apvis 2011 |
APVIS
2011
12 years 9 months ago
2011
Graphs are often used to encapsulate relationships between objects. Node-link diagrams, commonly used to visualize graphs, suffer from visual clutter on large graphs. Edge bundlin...
APVIS
2011
12 years 9 months ago
2011
NETSPEAK helps writers in choosing words while writing a text. It checks for the commonness of phrases and allows for the retrieval of alternatives by means of wildcard queries. T...
APVIS
2011
2011
Loose capacity-constrained representatives for the qualitative visual analysis in molecular dynamics
12 years 9 months ago
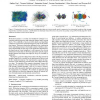
Molecular dynamics is a widely used simulation technique to investigate material properties and structural changes under external forces. The availability of more powerful cluster...
APVIS
2011
12 years 9 months ago
2011
Visualization of flow fields with geometric primitives is often challenging due to occlusion that is inevitably introduced by 3D streamlines. In this paper, we present a novel v...
APVIS
2011
12 years 9 months ago
2011
Robust analysis of vector fields has been established as an important tool for deriving insights from the complex systems these fields model. Many analysis techniques rely on co...


