APVIS
2006
13 years 6 months ago
2006
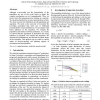
Although overcrowded and the depopulation of the population are one of the social issues in Japan, the complex mechanisms are not comprehended. Then, we tried to show this phenome...
APVIS
2006
13 years 6 months ago
2006
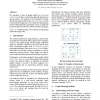
We introduce a class of graphs called an intersecting clustered graph that is a clustered graph with intersections among clusters. We propose a novel method for nicely drawing the...
APVIS
2006
13 years 6 months ago
2006
The Internet consists of several billion documents. Choosing information from such a great number of Web pages is not easy. We do not think that the interfaces of traditional sear...
APVIS
2006
13 years 6 months ago
2006
The complexity and size of data is rapidly increasing in modern science, business and engineering. This has resulted in increasing demands for more sophisticated data analysis met...
APVIS
2006
13 years 6 months ago
2006
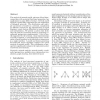
A common problem in visualising some networks is the presence of localised high density areas in an otherwise sparse graph. Applying common graph drawing algorithms on such networ...
APVIS
2006
13 years 6 months ago
2006
The geometry PIG is a system that can inspect the inside of a pipeline. The amount of pigging data is usually considerable because the system records multi-channel sensor values f...
APVIS
2006
13 years 6 months ago
2006
Evidence-based medicine (EBM) is a shift in which medicine from being based on individual experience of doctors to evidence with clear background. In this shift, data mining can p...
APVIS
2006
13 years 6 months ago
2006
A method of drawing anchored maps for bipartite graphs is presented. Suppose that the node set of a bipartite graph is divided into set A and set B. On an anchored map of the bipa...
APVIS
2006
13 years 6 months ago
2006
Software systems have become increasingly complex over the years. Complexity metrics measures software complexity using real numbers. It is, however, hard to gain insight into dif...
APVIS
2006
13 years 6 months ago
2006
The analysis of network motifs, patterns of local interconnections with potential functional properties, has applications in many fields of science. Network motif analysis is part...


