ICANN
2010
Springer
13 years 5 months ago
2010
Springer
Abstract. The Self-Organising Map (SOM) is a well-known neuralnetwork model that has successfully been used as a data analysis tool in many different domains. The SOM provides a to...
INTERACT
2003
13 years 6 months ago
2003
Abstract: We show the application of the data analysis tool InfoZoom to a database of Formula One racing results. The user can interactively explore different tabular visualisation...
CHI
2007
ACM
14 years 5 months ago
2007
ACM
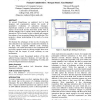
We present ExperiScope, an analytical tool to help designers and experimenters explore the results of quantitative evaluations of interaction techniques. ExperiScope combines a ne...


