AVI
2010
13 years 6 months ago
2010
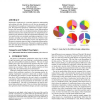
Information visualization is a powerful method for understanding and working with data. However, we still have an incomplete understanding of how people use visualization to think...
APVIS
2007
13 years 6 months ago
2007
Open source software projects such as Apache and Mozilla present an opportunity for information visualization. Since these projects typically require collaboration between develop...
CHI
2008
ACM
13 years 6 months ago
2008
ACM
Information visualizations can improve collaborative problem solving, but this improvement may depend on whether visualizations promote communication. In an experiment on the effe...
AVI
2008
13 years 6 months ago
2008
Uncertainty in data occurs in domains ranging from natural science to medicine to computer science. By developing ways to include uncertainty in our information visualizations we ...
INFOVIS
1997
IEEE
13 years 8 months ago
1997
IEEE
Research on information visualization has reached the place where a number of successful point designs have been proposed and a number of techniques of been discovered. It is now ...
GD
2000
Springer
13 years 8 months ago
2000
Springer
GraphXML is a graph description language in XML that can be used as an interchange format for graph drawing and visualization packages. The generality and rich features of XML mak...
GRAPHITE
2007
ACM
13 years 8 months ago
2007
ACM
This review tells about the International Conference on Information Visualization that is held annually in London, England. Themes selected from the Conference Proceedings are foc...
INFOVIS
1997
IEEE
13 years 8 months ago
1997
IEEE
In information visualization, as the volume and complexity of the data increases, researchers require more powerful visualization tools that enable them to more effectively explor...
NPIV
1998
ACM
13 years 8 months ago
1998
ACM
Nowadays, many state-of-the-art user interfaces to complexly structured data collections require appropriate information visualization methods. With the increase in graphics perfo...
INFOVIS
1998
IEEE
13 years 8 months ago
1998
IEEE
Geographic Visualization, sometimes called cartographic visualization, is a form of information visualization in which principles from cartography, geographic information systems ...
