Free Online Productivity Tools
i2Speak
i2Symbol
i2OCR
iTex2Img
iWeb2Print
iWeb2Shot
i2Type
iPdf2Split
iPdf2Merge
i2Bopomofo
i2Arabic
i2Style
i2Image
i2PDF
iLatex2Rtf
Sci2ools
VIS
2009
IEEE
2009
IEEE
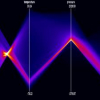
Continuous Parallel Coordinates
Typical scientific data is represented on a grid with appropriate interpolation or approximation schemes, defined on a continuous domain. The visualization of such data in parallel coordinates may reveal patterns latently contained in the data and thus can improve the understanding of multidimensional relations. In this paper, we adopt the concept of continuous scatterplots for the visualization of spatially continuous input data to derive a density model for parallel coordinates. Based on the point?line duality between scatterplots and parallel coordinates, we propose a mathematical model that maps density from a continuous scatterplot to parallel coordinates and present different algorithms for both numerical and analytical computation of the resulting density field. In addition, we show how the 2-D model can be used to successively construct continuous parallel coordinates with an arbitrary number of dimensions. Since continuous parallel coordinates interpolate data values within gr...
Continuous Input Data | Continuous Parallel Coordinates | Continuous Scatterplots | VIS 2009 | Visualization |
Related Content
| Added | 06 Nov 2009 |
| Updated | 18 Nov 2009 |
| Type | Conference |
| Year | 2009 |
| Where | VIS |
| Authors | Julian Heinrich, Daniel Weiskopf |
Comments (0)

