VIS
2009
IEEE
14 years 10 months ago
2009
IEEE
In this paper we present a novel focus+context zooming technique, which allows users to zoom into a route and its associated landmarks in a 3D urban environment from a 45-degree bi...
VIS
2009
IEEE
14 years 10 months ago
2009
IEEE
Visualization is essential for understanding the increasing volumes of digital data. However, the process required to create insightful visualizations is involved and time consumin...
VIS
2009
IEEE
14 years 10 months ago
2009
IEEE
Typical scientific data is represented on a grid with appropriate interpolation or approximation schemes, defined on a continuous domain. The visualization of such data in parallel...
VIS
2009
IEEE
14 years 10 months ago
2009
IEEE
In this paper, we present a visualization system for the visual analysis of PET/CT scans of aortic arches of mice. The system has been designed in close collaboration between resea...
VIS
2009
IEEE
14 years 10 months ago
2009
IEEE
VIS
2009
IEEE
14 years 10 months ago
2009
IEEE
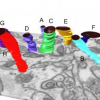
Abstract-- Neurobiology investigates how anatomical and physiological relationships in the nervous system mediate behavior. Molecular genetic techniques, applied to species such as...
VIS
2009
IEEE
14 years 10 months ago
2009
IEEE
Confocal microscopy is widely used in neurobiology for studying the three-dimensional structure of the nervous system. Confocal image data are often multi-channel, with each channe...
VIS
2009
IEEE
14 years 10 months ago
2009
IEEE
VIS
2009
IEEE
14 years 10 months ago
2009
IEEE
VIS
2009
IEEE
14 years 10 months ago
2009
IEEE
We introduce a new method for coloring 3D line fields and show results from its application in visualizing orientation in DTI brain data sets. The method uses Boy's surface, a...

