3125 search results - page 212 / 625 » Development of a Visual Space-Mouse |
110
click to vote
ICDCS
2010
IEEE
15 years 2 months ago
2010
IEEE
Abstract—The distributed nature and large scale of MapReduce programs and systems poses two challenges in using existing profiling and debugging tools to understand MapReduce pr...
EWSPT
1995
Springer
15 years 2 months ago
1995
Springer
A wide variety of techniques and approaches are needed to understand and improve software development processes. The critical research problem is supporting the move from completel...
AVI
2008
15 years 1 months ago
2008
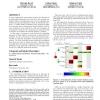
In many applications transactions between the elements of an information hierarchy occur over time. For example, the product offers of a department store can be organized into pro...
LISA
2008
15 years 1 months ago
2008
Abstract-- With the prevalence of multi-user environments, it has become an increasingly challenging task to precisely identify who is doing what on an enterprise network. Current ...
APVIS
2006
15 years 3 days ago
2006
The geometry PIG is a system that can inspect the inside of a pipeline. The amount of pigging data is usually considerable because the system records multi-channel sensor values f...


