390 search results - page 3 / 78 » Explorable images for visualizing volume data |
110
click to vote
CGF
2008
15 years 1 months ago
2008
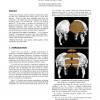
Teaser Figure: Left: Brain, visualized using silhouettes, the lesion's spatial depth is displayed using a ring. Center: Combined rendering of brain tissue, skull and fiber tr...
113
click to vote
VISUALIZATION
2000
IEEE
15 years 6 months ago
2000
IEEE
Visualization techniques enable scientists to interactively explore 3D data sets, segmenting and cutting them to reveal inner structure. While powerful, these techniques suffer fr...
135
click to vote
CG
1999
Springer
15 years 1 months ago
1999
Springer
In order to make direct volume rendering practicable convenient visualization options and data analysis tools have to be integrated. For example, direct rendering of semi-transpar...
132
Voted
VVS
1992
IEEE
15 years 5 months ago
1992
IEEE
Current techniques for direct volume visualization offer only the ability to examine scalar fields. However most scientific explorations require the examination of vector and poss...
125
click to vote
VIS
2007
IEEE
16 years 3 months ago
2007
IEEE
The effectiveness of direct volume rendering is difficult to validate and users may not know whether they have successfully explored the data or not. This limits its applications....


