501 search results - page 41 / 101 » Interactive Visual Analysis of Perfusion Data |
110
click to vote
IV
2007
IEEE
15 years 7 months ago
2007
IEEE
Geovisualization (GeoViz) is an intrinsically complex process. The analyst needs to look at data from various perspectives and at various scales, from “seeing the whole” to �...
134
click to vote
BMCBI
2008
15 years 1 months ago
2008
Background: Genome wide association (GWA) studies are now being widely undertaken aiming to find the link between genetic variations and common diseases. Ideally, a well-powered G...
109
click to vote
CHI
2011
ACM
14 years 5 months ago
2011
ACM
Event sequence analysis is an important task in many domains: medical researchers may study the patterns of transfers within the hospital for quality control; transportation exper...
110
click to vote
INFOVIS
2000
IEEE
15 years 5 months ago
2000
IEEE
Data visualization environments help users understand and analyze their data by permitting interactive browsing of graphical representations of the data. To further facilitate und...
CVPR
2010
IEEE
15 years 9 months ago
2010
IEEE
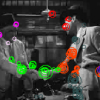
We present a novel approach to the causal temporal analysis of event data from video content. Our key observation is that the sequence of visual words produced by a space-time dic...


