694 search results - page 113 / 139 » Interactive visual analysis of time-series microarray data |
CORR
2004
Springer
14 years 9 months ago
2004
Springer
While being it extremely important, many Exploratory Data Analysis (EDA [21]) systems have the inhability to perform classification and visualization in a continuous basis or to se...
102
click to vote
CASCON
1996
14 years 11 months ago
1996
Monitoring distributed systems involves the collection, analysis, and display of interactions among managed objects. These functions are carried out by the components of a monitor...
AVI
2010
14 years 11 months ago
2010
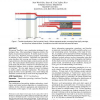
We present TimeNets, a new visualization technique for genealogical data. Most genealogical diagrams prioritize the display of generational relations. To enable analysis of famili...
107
click to vote
HICSS
2007
IEEE
15 years 4 months ago
2007
IEEE
Understanding collaborative work practices represents a critical factor in and a necessary fundament for the development of effective Computer Supported Collaborative Work (CSCW) ...
BMCBI
2007
14 years 9 months ago
2007
Background: Three dimensional biomedical image sets are becoming ubiquitous, along with the canonical atlases providing the necessary spatial context for analysis. To make full us...


