1907 search results - page 67 / 382 » Self-Organizing Visual Maps |
112
click to vote
VISUALIZATION
2000
IEEE
15 years 4 months ago
2000
IEEE
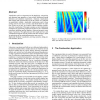
Visualization can be an important tool for displaying, categorizing and digesting large quantities of inter-related information during laboratory and simulation experiments. Summa...
119
click to vote
TVCG
2012
13 years 2 months ago
2012
—Motion perception in immersive virtual environments significantly differs from the real world. For example, previous work has shown that users tend to underestimate travel dista...
IUI
2004
ACM
15 years 5 months ago
2004
ACM
Layout refers to the process of determining the size and position of the visual objects in an information presentation. We introduce the WeightMap, a bitmap representation of the ...
116
click to vote
APVIS
2011
13 years 12 months ago
2011
Maps offer a familiar way to present geographic data (continents, countries), and additional information (topography, geology), can be displayed with the help of contours and heat...
CVPR
2004
IEEE
16 years 1 months ago
2004
IEEE
In this paper, we study how estimates of ego-motion based on feature tracking (visual odometry) can be improved using a rough (low accuracy) map of where the observer has been. We...


