545 search results - page 22 / 109 » Space, time and visual analytics |
SOFTVIS
2010
ACM
14 years 10 months ago
2010
ACM
When software developers work with a program's source code, the structure of the source code often requires that they split their attention simultaneously across several docu...
VISUALIZATION
2003
IEEE
15 years 3 months ago
2003
IEEE
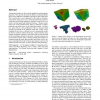
Unstructured meshes are often used in simulations and imaging applications. They provide advanced flexibility in modeling abilities but are more difficult to manipulate and anal...
IV
2009
IEEE
15 years 4 months ago
2009
IEEE
We have various interesting time series data in our daily life, such as weather data (e.g., temperature and air pressure) and stock prices. Polyline chart is one of the most commo...
IV
2010
IEEE
14 years 8 months ago
2010
IEEE
We represent time-varying data as polyline charts very often. At the same time, we often need to observe hundreds or even thousands of time-varying values in one chart. However, i...
VLDB
2004
ACM
15 years 3 months ago
2004
ACM
Moments before the launch of every space vehicle, engineering discipline specialists must make a critical go/no-go decision. The cost of a false positive, allowing a launch in spi...


