168 search results - page 11 / 34 » Visualization and exploration of time-varying medical image ... |
CGF
2008
14 years 11 months ago
2008
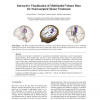
Teaser Figure: Left: Brain, visualized using silhouettes, the lesion's spatial depth is displayed using a ring. Center: Combined rendering of brain tissue, skull and fiber tr...
109
click to vote
PLDI
2012
ACM
13 years 1 months ago
2012
ACM
Research scientists and medical professionals use imaging technology, such as computed tomography (CT) and magnetic resonance imaging (MRI) to measure a wide variety of biological...
108
click to vote
VIS
2008
IEEE
16 years 18 days ago
2008
IEEE
The visualization of complex 3D images remains a challenge, a fact that is magnified by the difficulty to classify or segment volume data. In this paper, we introduce size-based tr...
VISUALIZATION
2002
IEEE
15 years 4 months ago
2002
IEEE
Isosurfaces are commonly used to visualize scalar fields. Critical isovalues indicate isosurface topology changes: the creation of new surface components, merging of surface comp...
GECCO
2003
Springer
15 years 4 months ago
2003
Springer
Learning Bayesian networks from data has been studied extensively in the evolutionary algorithm communities [Larranaga96, Wong99]. We have previously explored extending some of the...


