244 search results - page 20 / 49 » Visualization of Differences in Data Measuring Mathematical ... |
DAGSTUHL
2010
15 years 3 months ago
2010
Modeling complex organs, such as the human heart, requires a detailed understanding of the geometric and mechanical properties of that organ. Similarly, the model is only as accur...
127
click to vote
VIS
2007
IEEE
16 years 3 months ago
2007
IEEE
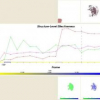
The effectiveness of direct volume rendering is difficult to validate and users may not know whether they have successfully explored the data or not. This limits its applications....
116
click to vote
CHI
2009
ACM
16 years 2 months ago
2009
ACM
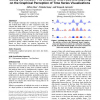
We investigate techniques for visualizing time series data and evaluate their effect in value comparison tasks. We compare line charts with horizon graphs--a space-efficient time ...
105
click to vote
UIALL
2004
Springer
15 years 7 months ago
2004
Springer
Abstract. We present the results of an exploratory study investigating the feasibility of using multimedia software to teach life skills to adults with learning difficulties. As a ...
117
click to vote
INFOVIS
2005
IEEE
15 years 7 months ago
2005
IEEE
In order to gain insight into multivariate data, complex structures must be analysed and understood. Parallel coordinates is an excellent tool for visualizing this type of data bu...


