410 search results - page 17 / 82 » Visually representing geo-temporal differences |
INFOVIS
2005
IEEE
15 years 4 months ago
2005
IEEE
In order to gain insight into multivariate data, complex structures must be analysed and understood. Parallel coordinates is an excellent tool for visualizing this type of data bu...
103
click to vote
IEEEMM
2002
14 years 11 months ago
2002
ion when we annotate content. This therefore requires us to investigate and model video semantics. Because of the type and volume of data, general-purpose approaches are likely to ...
VIS
2006
IEEE
16 years 10 days ago
2006
IEEE
ing Abstract Data Using Animation Amit P. Sawant Department of Computer Science, North Carolina State University Christopher G. Healey Department of Computer Science, North Carolin...
ICSM
2007
IEEE
15 years 5 months ago
2007
IEEE
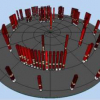
Large object-oriented applications are structured over large number of packages. Packages are important but complex structural entities that may be difficult to understand since ...
IUI
2000
ACM
15 years 3 months ago
2000
ACM
The ability to quickly explore and compare multiple scenarios is an important component of exploratory data analysis. Yet today’s interfaces cannot represent alternative explora...


