410 search results - page 20 / 82 » Visually representing geo-temporal differences |
103
click to vote
DMIN
2006
15 years 14 days ago
2006
: Temporal data mining is concerned with the analysis of temporal data and finding temporal patterns, regularities, trends, clusters in sets of temporal data. Wavelet transform pro...
CGF
2008
14 years 11 months ago
2008
The evolution of dependencies in information hierarchies can be modeled by sequences of compound digraphs with edge weights. In this paper we present a novel approach to visualize...
96
Voted
VISUALIZATION
2005
IEEE
15 years 4 months ago
2005
IEEE
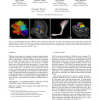
Diffusion tensor imaging is a magnetic resonance imaging method which has gained increasing importance in neuroscience and especially in neurosurgery. It acquires diffusion proper...
APVIS
2007
15 years 16 days ago
2007
In this paper, we introduce a new method, GraphScape, to visualize multivariate networks, i.e., graphs with multivariate data associated with their nodes. GraphScape adopts a land...
SSDBM
2003
IEEE
15 years 4 months ago
2003
IEEE
Accessing data stored in persistent memory represents a bottleneck for current visual exploration applications. Semantic caching of frequent queries at the client-side along with ...


