387 search results - page 5 / 78 » An Occlusion-Reduced 3D Hierarchical Data Visualization Tech... |
VISSYM
2007
15 years 2 months ago
2007
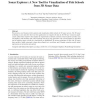
We present a novel framework for analysis and visualization of fish schools in 3D sonar surveys. The 3D sonar technology is new and there have not been applications to visualize t...
127
click to vote
ISVC
2009
Springer
15 years 4 months ago
2009
Springer
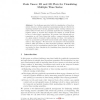
Abstract. One challenge associated with the visualization of time-dependent data is to develop graphical representations that are effective for exploring multiple time-varying qua...
VRML
1995
ACM
15 years 3 months ago
1995
ACM
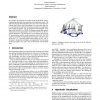
We visualize the structure of sections of the World Wide Web by constructing graphical representations in 3D hyperbolic space. The felicitous property that hyperbolic space has â€...
112
Voted
Publication
Abstract—In the analysis of spatially-referenced timedependent
data, gaining an understanding of the spatiotemporal
distributions and relationships among the attributes
in the...
SOFTVIS
2010
ACM
14 years 11 months ago
2010
ACM
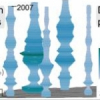
Previous techniques for visualizing time-series of multivariate data mostly plot the time along additional axes, are often complex, and does not support intuitive interaction. In ...


