454 search results - page 73 / 91 » Comprehension of Software Analysis Data Using 3D Visualizati... |
123
Voted
BMCBI
2006
15 years 2 months ago
2006
Background: The Gene Ontology has become an extremely useful tool for the analysis of genomic data and structuring of biological knowledge. Several excellent software tools for na...
114
click to vote
AVI
2010
15 years 3 months ago
2010
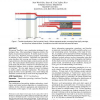
We present TimeNets, a new visualization technique for genealogical data. Most genealogical diagrams prioritize the display of generational relations. To enable analysis of famili...
145
click to vote
AVI
2006
15 years 3 months ago
2006
Scientific measurements are often depicted as line graphs. Stateof-the-art high throughput systems in life sciences, telemetry and electronics measurement rapidly generate hundred...
116
click to vote
BMCBI
2010
15 years 2 months ago
2010
Background: Selective pressure in molecular evolution leads to uneven distributions of amino acids and nucleotides. In fact one observes correlations among such constituents due t...
175
click to vote
COOPIS
1996
IEEE
15 years 6 months ago
1996
IEEE
Rational drug design is an example where integrated access to heterogeneous scientific data is urgently needed, as it becomes rapidly available due to new experimental and computa...


