137
click to vote
SOFTVIS
15 years 8 months ago
2006 ACM
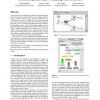
We present Clack, a graphical environment for teaching students how Internet routers work and other core networking concepts. Clack is a router written as a Java Applet, and route...
131
click to vote
SOFTVIS
15 years 8 months ago
2006 ACM
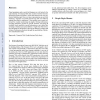
Visual paradigms such as node-link diagrams are well suited to the representation of Semantic Web data encoded with the Resource Description Framework (RDF), whose data model can ...
108
click to vote
SOFTVIS
15 years 8 months ago
2006 ACM
The analysis of the runtime behavior of a software system yields vast amounts of information, making accurate interpretations difficult. Filtering or compression techniques are o...
124
click to vote
SOFTVIS
15 years 8 months ago
2006 ACM
Data visualization is the process of representing data as pictures to support reasoning about the underlying data. For the interpretation to be as easy as possible, we need to be ...
|
Visualization


